|
Clutch-size Variation in
Eastern Bluebirds
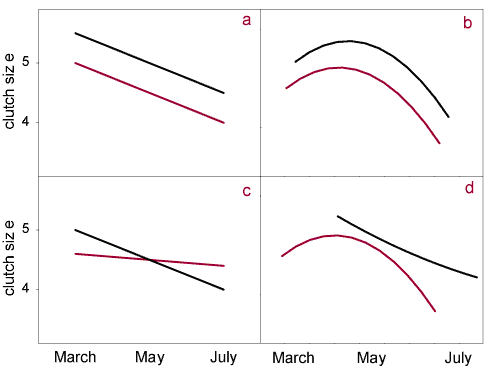
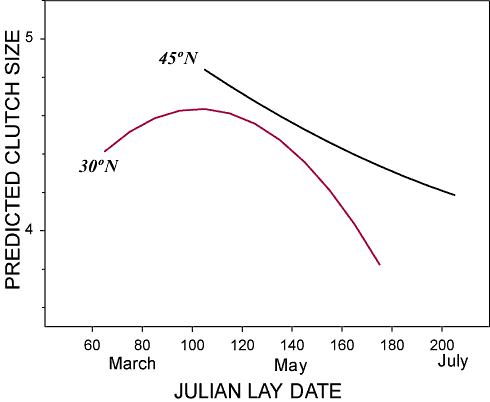
Birdhouse monitors document previously unknown results When we began the Cornell Nest Box Network (CNBN) three years ago, we were quite ambitious: we wanted to study how clutch size (the number of eggs females lay in one nest attempt) varied geographically, the effects of blowflies on reproduction and possible effects of calcium deficiency on egg quality . These studies simply required observations around nest boxes (clutch size, blowflies) or simple experiments (calcium) by project members. On top of that, we also began studies of dispersal by training large numbers of citizen scientists in the art of bird banding. Although the number of participants in CNBN was not as large as we had hoped, we did obtain a substantial amount of data on the reproductive biology of cavity-nesting birds. This article summarizes data pertaining to factors that influence clutch size variation in Eastern Bluebirds (Sialia sialis). Our main questions were, would clutch size in Eastern Bluebirds increase from south to north and from east to west? Although such a pattern has been found in some bird species, literature on whether such a pattern generally exists in most bird species has been controversial. Regarding the Eastern Bluebird itself, an earlier analysis of the Lab of Ornithology’s Nest Record Cards published in Living Bird in 1970 could not document significant clutch size variations with latitude (D. B. Peakall. 1970. “The Eastern Bluebird: Its Breeding Season, Clutch Size, and Nesting Success.” Living Bird 9, 239-256.). One reason there is still so much controversy about geographic variation of clutch size is that many other factors can influence clutch size, and often not all factors are taken into account when analyzing data. For example, in many bird species older females, or birds that breed early, at lower altitudes or in larger nest boxes tend to lay larger clutches than younger females or those that lay later in the season, at higher elevations or in smaller cavities. Furthermore, birds tend to lay more eggs in some years than in others. To carry out a meaningful analysis, researchers need a large data set, spread over the entire breeding season. That way, even though we don’t know the age of the female or the quality of her territory, we can partition out possible effects of egg-laying date, year, altitude, or nest-box volume. In 1997 and 1998, CNBN participants reported data on 2,234 nesting attempts of Eastern Bluebirds as far south as Florida and Texas and as far north as North Dakota and the Canadian provinces of Quebec and Ontario. To be certain that the clutches we analyzed were complete clutches, we included only data from nests in which young had been observed. That left us with 611 clutches for which we had information on all of the variables we wanted to study. Because the first analysis showed no effect for nest box volume or altitude, we could then add 334 more observations. The distribution of reported latitudes (29.88-48.60º N) and longitudes (103.34-70.03º W) spanned the Eastern Bluebird’s range in North America, although the majority of observations came from the northeastern United States. The results described below are based on the 945 observations for which we had information on clutch size, egg-laying date, latitude, and longitude. The mean clutch size was 4.49 eggs, with extremes of 2 and 7 eggs. We calculated whether latitude, longitude, egg-laying date, and year in which the clutch was laid had significant effects on clutch size. The results? As explained in Figure 1, we needed to use complex statistical techniques and generate rather complicated results to answer a simple question: Does clutch size vary with geographic location? The quick answer is yes. Clutch size increases from south to north and from east to west.
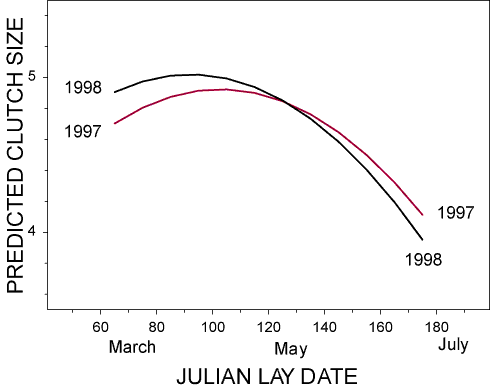
Finally, we found that clutches laid in 1997 were different from those laid in 1998. Thus, at a given location, early clutches were larger in 1998 than in 1997, whereas for clutches laid late in the season, the opposite was true (see Figure 3). Once more these results illustrate the power of citizen science. By coordinating the efforts of hundreds of careful observers, we have documented a previously unknown result. If we continue to collect these kinds of data, we should be able to determine, for example, to what extent global warming has variable effects for different species and for a single species in different parts of its range (see cover story). We can also ponder why our study revealed a pattern in Eastern Bluebirds that had remained hidden until our project took flight. We believe there are several reasons for this. One is that in previous analyses, data from all years were lumped together, and we found from this study that clutches varied between years. We now have powerful statistical tools at our disposal that permit the kind of complicated analysis that was needed for this report-tools unavailable just five years ago. Having data collected by participants all across the country enabled us to compare differences in clutch size across the entire range of the Eastern Bluebird.
These initial findings are exciting and unprecedented, and we thank all of our participants for monitoring their nest boxes and providing the data that made this analysis possible. We hope everyone who has nest boxes will sign up for The Birdhouse Network (TBN), our new name for the Cornell Nest Box Network. With your participation and valuable data, TBN will continue to examine environmental factors affecting clutch size. If you are not a member of The Birdhouse Network but would like to join, please visit the web site at http://birds.cornell.edu/birdhouse/, send e-mail to us at birdhouse@cornell.edu, or call (800) 843-BIRD. |


