-
 Substrate quality
 Substrate quantity
 C:N ratio
-
 1. Conifer Needle decomposition
 2. Cereal Shoots
 3. Mycorrhizas
 4.
Dutch Elm Disease
![]() 1. Organisms (microbes,
plants and animals)
1. Organisms (microbes,
plants and animals)
![]() 2. Substrates (dead roots,
leaves, dead organisms, pesticides)
2. Substrates (dead roots,
leaves, dead organisms, pesticides)
![]() 3. Environment (water,
air and soil particles)
3. Environment (water,
air and soil particles)
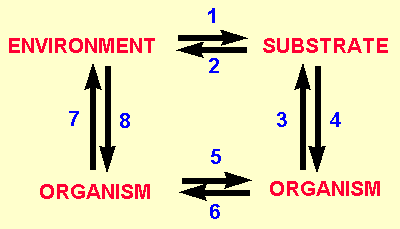
The interaction of these three groups can be shown
diagramatically in the following schematic figure. The arrows
denote one factor influencing another. In summary all the factors
can influence one another making the study of soil population
ecology very difficult and complex. Examples for each of the arrows
are given underneath.
Why is microbial population ecology
important ?
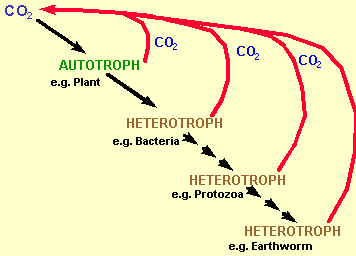
Basically because few soil processes are carried out by a single organism alone. Most are carried out by a group of microbes living together within a dynamic community. Examples of soil processes involving more than one organism are:
Food Webs
![]() There are rarely clear
successions in cycling pathways e.g. the succession of organisms
involved in oak leaf decomposition is different in the UK from
that of the USA, and, decomposition is different in a Cambisol
compared to a Podzolic soil. There is no one specific decomposition
pathway just generalisations.
There are rarely clear
successions in cycling pathways e.g. the succession of organisms
involved in oak leaf decomposition is different in the UK from
that of the USA, and, decomposition is different in a Cambisol
compared to a Podzolic soil. There is no one specific decomposition
pathway just generalisations.
![]() Food webs are normally interconnected
and extremely complex
Food webs are normally interconnected
and extremely complex
![]() We know that there are
1000's of species in soil so the food webs must implicitly be
complex.
We know that there are
1000's of species in soil so the food webs must implicitly be
complex.
![]() In addition the pathways
are not simple i.e. fungi are not predated only by nematodes (i.e.
can be defined by a single one way arrow).
In addition the pathways
are not simple i.e. fungi are not predated only by nematodes (i.e.
can be defined by a single one way arrow).
![]() Food webs are very environment
dependent (its not the same for all soils)
Food webs are very environment
dependent (its not the same for all soils)
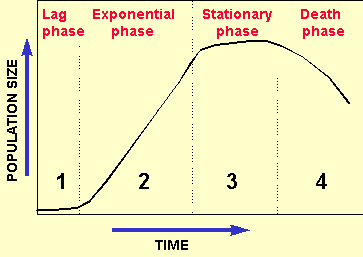
![]() 1. Lag phase
1. Lag phase
![]() 2. Exponential phase
2. Exponential phase
![]() 3. Stationary phase
3. Stationary phase
![]() 4. Death phase
4. Death phase
Example calculation (to put things in perspective)
If a single bacterium kept
dividing exponentially every hour this is how many microbes (clones)
you would have after 4 days:
| Time (hours) | Bacteria Population Size |
|---|---|
| 0 | 1 |
| 24 | 16 million |
| 48 | 280000000 million |
| 72 | 4700000000000000 million |
| 96 | 79000000000000000000000 million |
![]() Now we will talk about two
important concepts: Succession and Competition
Now we will talk about two
important concepts: Succession and Competition
![]() Succession
Succession
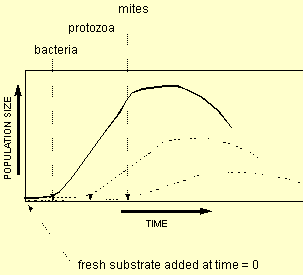
Below is a graph showing succession of three groups
of organisms. Substrate has been added as time = 0 and bacteria
have responded by growing (in 4 phases as described above). As
protozoa are triggered into action by bacteria, they don't start
growing until the bacteria are in exponential phase. They then
go through four phase growth. This is followed similarly by protozoal
predators mites. Note that all go through 4 phases of growth
and that the population numbers are lower at each stage. Secondly
note that the curves start and finish at different times. i.e.
the time of death is not the same for bacteria and mites. The 3 curves represent from left to right, bacteria, protozoa and mites repectively
![]() Competition
Competition
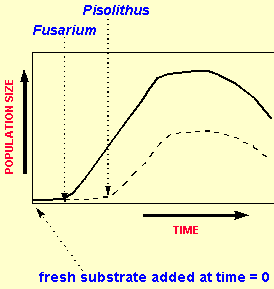
Here we have on the surface similarly looking graphs for two fungal species. However, it is subtly different and is characteristic of competition. Fusarium is the top curve and Pisolithus the botton curve. Here the substrate has been added at time =0 and Fusarium has reacted first. Pisolithus, however, can also use this substrate but it takes longer to turn on the necessary apparatus for transport (maybe it has only a few membrane receptors for this substrate). The important point to note, however, is that they both go into stationary phase and death phase at the same time. This indicates that they are both using the substrate and that Pisolithus is not using Fusarium as a substrate. Basically Fusarium has out-competed (higher population) Pisolithus for the substrate.
![]() This leads us onto two soil microbiolgical terms
to describe fast and slow growers in soil. These are
This leads us onto two soil microbiolgical terms
to describe fast and slow growers in soil. These are
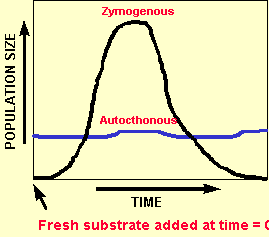
Zymogenous
![]() Organisms which grow extremely
rapidly when a new substrate arrives
Organisms which grow extremely
rapidly when a new substrate arrives
![]() The are 'boom' and 'bust'
(i.e. big fluctuations in pop'n numbers)
The are 'boom' and 'bust'
(i.e. big fluctuations in pop'n numbers)
![]() They are not long lived
They are not long lived
![]() They spend most of their
time in hibernation (waiting for substrate)
They spend most of their
time in hibernation (waiting for substrate)
![]() They are more adapted to
taking up substrate at high concentrations
They are more adapted to
taking up substrate at high concentrations
![]() They are uncommon in soil
(as soil is normally substrate limiting)
They are uncommon in soil
(as soil is normally substrate limiting)
![]() They are analogous to 'r
strategists'
They are analogous to 'r
strategists'
Autochthonus
![]() Organisms which grow slowly
when new substrate is added
Organisms which grow slowly
when new substrate is added
![]() Their populations tend
to be more stable
Their populations tend
to be more stable
![]() They are longer lived
They are longer lived
![]() They are more adapted to
taking up substrate at low concentrations
They are more adapted to
taking up substrate at low concentrations
![]() They are common in soil
They are common in soil
![]() They are analogous to 'K
strategists'
They are analogous to 'K
strategists'
Below is a graph of the population numbers versus time for each group
![]() Substrates, microbes and
the environment
Substrates, microbes and
the environment
Inputs of Substrate to the Soil
![]() Example: Mixed Temperate
Forest Ecosystem
Example: Mixed Temperate
Forest Ecosystem
| Tropics | Temperate | |
|---|---|---|
| Net Primary production (g/m2) | 2200 | 1200 |
| Soil Organic Carbon (g/m2) | 1900 | 7000 |
| Total Microbial Carbon (g/m2) | 80 | 90 |
| Active Microbial Biomass Carbon (g/m2) | 8 | 9 |
Substrate Quality
![]() Most substrates are 90
% water (10 % dry matter)
Most substrates are 90
% water (10 % dry matter)
![]() Substrate quality determines
how fast it's broken down
Substrate quality determines
how fast it's broken down
![]() Generally the more nutrients
the substrate contains - the faster it is broken down
Generally the more nutrients
the substrate contains - the faster it is broken down
![]() Microbes need not just
C but other nutrients as well
Microbes need not just
C but other nutrients as well
Here is a table of the typical macronutrient content (% of dry weight)
of two groups of organisms and two substrates.
| Macronutrient |
Bacterial cells | Fungal cells | Green Shoots | Cereal Straw |
|---|---|---|---|---|
| C | 50 | 40 | 40 | 40 |
| N | 6.25 | 2.5 | 1 | 0.4 |
| P | 3 | 0.6 | 0.2 | 0.1 |
| S | 1 | 0.4 | 0.2 | 0.1 |
| C:N Ratio | 8 | 16 | 40 | 100 |
![]() One important point is the
carbon to nitrogen ration (C:N ratio). These are the two nutrients
most needed by microbial cells for growth as they are used to make
proteins, cell walls etc. From the C: N ratio we can guess at
which organisms might decompose it
One important point is the
carbon to nitrogen ration (C:N ratio). These are the two nutrients
most needed by microbial cells for growth as they are used to make
proteins, cell walls etc. From the C: N ratio we can guess at
which organisms might decompose it
![]() Note the C:N ration of fungi
(16) is much greater than that for bacteria (8), and that both
are lower than that of crop residues (40-100).
Note the C:N ration of fungi
(16) is much greater than that for bacteria (8), and that both
are lower than that of crop residues (40-100).
![]()
CASE STUDY 1:
Decomposition of Conifer Needles
![]() Generally the substrate
quality is poor for the following reasons
Generally the substrate
quality is poor for the following reasons
![]() The substrate is dry needles
with waxy cuticles
The substrate is dry needles
with waxy cuticles
![]() The waxy cuticle covers
the stomata to prevent fungal spores getting in
The waxy cuticle covers
the stomata to prevent fungal spores getting in
![]() They contain antibiotic
resins
They contain antibiotic
resins
![]() N and P contents are
<1 % (low)
N and P contents are
<1 % (low)
![]() C:N ratio is about 40
C:N ratio is about 40
![]() major components
major components

![]() Needles constitute about
75 % of the total surface litter inputs (other inc. cones, branches
etc)
Needles constitute about
75 % of the total surface litter inputs (other inc. cones, branches
etc)
![]() About 20 % of the needles
fall off a tree each year
About 20 % of the needles
fall off a tree each year
![]() There may be 10 times as
many needles on the floor as on the trees
There may be 10 times as
many needles on the floor as on the trees
![]() Needle drop is often seasonal
- this affects decomposition rate
Needle drop is often seasonal
- this affects decomposition rate
![]() Pinus sylvestris
Needles fall off in autumn
Pinus sylvestris
Needles fall off in autumn
![]() Picea abies Needles
fall off all year round
Picea abies Needles
fall off all year round
Microbial
decomposition
![]() It takes about 7-10 years
to degrade 70 % of the needle
It takes about 7-10 years
to degrade 70 % of the needle
![]() It takes about 30 years
to degrade 98 %
It takes about 30 years
to degrade 98 %
![]() The remaining 2 % is made
of highly recalcitrant organic matter which can last for up to
10,000 years (often complex phenolic material)
The remaining 2 % is made
of highly recalcitrant organic matter which can last for up to
10,000 years (often complex phenolic material)
![]() Over 150 fungi are involved
in the decomposition process
Over 150 fungi are involved
in the decomposition process
![]() Many bacteria, actinomycetes,
protozoa and mesofauna are also involved
Many bacteria, actinomycetes,
protozoa and mesofauna are also involved
![]() Decomposition probably involves
more than 300-500 individual species
Decomposition probably involves
more than 300-500 individual species
![]() Decomposition starts on
the tree not on the ground
Decomposition starts on
the tree not on the ground
![]() There is no definite species
succession (for the reasons given above)
There is no definite species
succession (for the reasons given above)
Below is an indication of some of the stages of pine needle decay (You don't want all 300 do you ?). I have split it into two sections. Decomposition on the tree and Decomposition on the ground.
A. Infection on the tree
(normally starts as a result of insect or abrasion
damage as otherwise needles are well protected)
Stage 1.
Auereobasidium pullulans (fungus which just lives on the
surface of the needle)
Stage 2.
Lophodermella sulcigena (strong pathogenic fungus which
infects the inside of the needles)
Stage 3.
Lophodermium pinastri (weak pathogenic
fungus which enters wound sites (some started by fungus in stage
2))
Stage 4.
Flavobacterium (opportunistic bacteria which enters after
2 and 3)
Stage 5.
Naemacyclus niveus (fungus which invades inside and causes
needles to finally fall off)
B. Infection on the ground (some of the fungi stages)
Stage 5.
Hyphae from Stages 1-4 are eaten by mesofauna (e.g. mites)
Stage 6.
The 4 fungi from above plus Fusicoccum bacillare sporulate
Stage 7.
Desmazierella acicola moves in (Fungi from stages 3 and
6 die out)
Stage 8.
Helicoma monospora replaces Aureobasidium on surface
Stage 9.
Desmazierella acicola takes over on the inside
Stage 10.
Mites, worms and springtails eat the fungal hyphae
Stage 11.
Trichoderma and Penicillium colonize the outside
Stage 12.
Mortierella and Chaetomium move into the inside
![]() This is only a fraction
of the stages but it can be seen that it is both succession and
competition a the same time.
This is only a fraction
of the stages but it can be seen that it is both succession and
competition a the same time.
![]() Decomposition nearly always
follow the schematic below where the easily degradable compounds
are used first with the substrate becoming harder to break down
with time (i.e. lignin is often left till last).
Decomposition nearly always
follow the schematic below where the easily degradable compounds
are used first with the substrate becoming harder to break down
with time (i.e. lignin is often left till last).
![]() Many compounds are protected
by lignin and phenolics e.g. Phenolic-protein complexes
Many compounds are protected
by lignin and phenolics e.g. Phenolic-protein complexes
Environment
![]() CASE STUDY 2: Decomposition of Cereal Shoots
CASE STUDY 2: Decomposition of Cereal Shoots
This
time we will not talk about the microbial succession, but some
more important features such as environment.
Substrate
quality
![]() They contain few antibiotic
resins
They contain few antibiotic
resins
![]() P and N concentration are
quite high
P and N concentration are
quite high
![]() C:N ratio is 30-60 (low)
C:N ratio is 30-60 (low)
![]() Major components
Major components
![]() Decomposition follows epidermis-cortex-endodermis-phloem-xylem
Decomposition follows epidermis-cortex-endodermis-phloem-xylem
![]() Again decomposition starts
when the shoot is alive (e.g. rust fungi)
Again decomposition starts
when the shoot is alive (e.g. rust fungi)
Environment
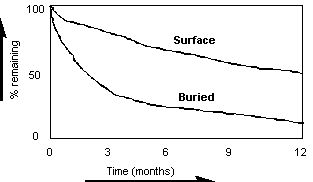
![]() Decomposition rate depends
largely on whether the shoots are buried or on the surface (this
is important when ploughing in crop residues)
Decomposition rate depends
largely on whether the shoots are buried or on the surface (this
is important when ploughing in crop residues)
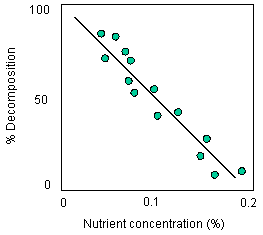
![]() decomposition is dependent
on nutrient concentration. Look at the following graph which plots
decomposition rate as a function of shoot macronutrient concentration
(N + P)
decomposition is dependent
on nutrient concentration. Look at the following graph which plots
decomposition rate as a function of shoot macronutrient concentration
(N + P)
![]() CASE STUDY 3: Ectomycorrhizae
CASE STUDY 3: Ectomycorrhizae
This isn't really decomposition population ecology (as above) but more the interaction of organisms in the environment. Here are two examples which I will use to illustrate the interaction between large animals and fungi. Here we can see that we can go from the bottom of the trophic ladder to the top in one step (compared to via 300 organisms and trophic levels in the conifer needle example).
Case Study 3A from New Mexico
Case Study 3B from France