Why are cells so small? The answer to this question has as much to do with mathematics as biology. Imagine that a cell is shaped roughly like a cube.
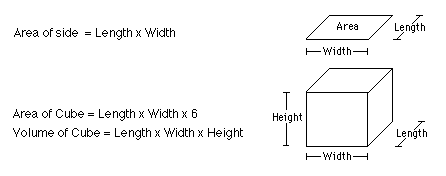
As cell size increases, its surface area to volume ratio changes. The surface area and volume are calculated as shown in the figure below:


The area of a side is equal to length x width. We can write that as A=L*W, and when the sides are the same length, we can write A=L2
Since a cube has six sides, let's also calculate the surface area of the whole exterior of the cell as 6 * L2
The volume of the cube is equal to length x width x height, or V=L*W*H, and when the sides are the same length, we can write V=L3
Here's where it gets interesting. As we keep doubling the variable L, from 1 to 2 to 4 to 8, surface area and volume don't increase at the same rate.
Questions:
1. List some of the things that cross a cell's membrane:
2. Why is it important that a cell have a large surface area relative to its volume? (In other words, a high surface area to volume ratio?)
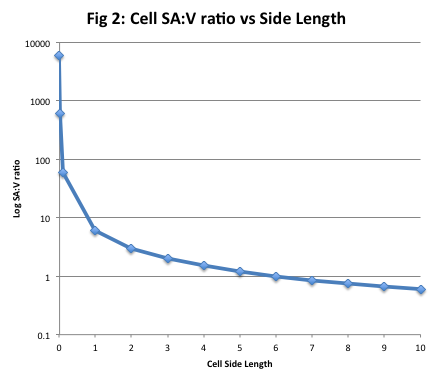
3. Imagine that a cell's side length could be any size that you wanted. Calculate what would happen to the surface area to volume ratio as the cell grows. The units here could be anything, since we're just hypothesizing.
|
|
L |
6L2 |
L3 |
6L2 / L3 |
|
|
|
|
|
|
|
|
|
|
|
|
|
|
||||
|
|
||||
|
|
||||
|
|
||||
|
|
||||
|
|
||||
|
|
||||
|
|
|
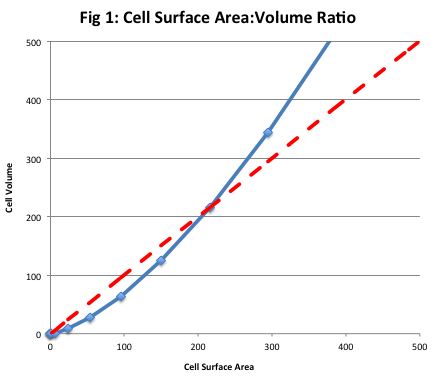
4. Make your own x-y graph with Create-A-Graph or Excel where x is surface area and y is volume, and plug in a range of values. What is happening to the surface area to volume ratio as cell size increases? (If the surface area and volume were increasing at the same rate, the line would be diagonal with a slope of 1.) What is actually happening at small sizes? At intermediate sizes? At large sizes? Download the Excel spreadsheet where I did my calculations and created these graphs: surface_area_volume_graph.xlsx.
5. Since transport of materials in and out of the cell can only happen at the cell's surface, what happens as cells get larger? How does this impose a limit on cell size?
6. It's not just cells that scale up in this way. Whole animals do too. The study of body size as it relates to anatomy, physiology, and behavior is called allometry. For homeotherms (animals that try to maintain a constant body temperature), it is necessary to make heat as it is lost to the environment in order to maintain equilibrium. If heat loss occurs only at the exposed surfaces, what would you predict about the metabolic rate per unit of body tissue of a large animal compared to a small one?
7. Take what you know about surface area to volume ratio and try to explain the following graph, which is known as the "mouse-to-elephant curve." Assume that metabolic rate relates to heat production and that all of these animals are trying to keep their bodies warm under the same environmental conditions. Note for example that an elephant has a mass (and volume) of more than 1000 times that of a mouse while its metabolic rate (and heat production) is only about 100 times that of a mouse. In other words, "Why can an elephant heat itself more efficiently (per unit of mass) than a mouse?"
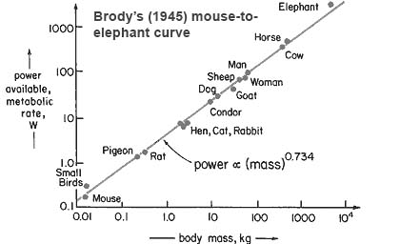
Brody's (1945) Mouse-to-Elephant Curve
8. "Allen's Rule" predicts that endothermic animals (ones that regulate their body temperature internally) with the same body volume should have different surface areas designed to either aid or impede their heat dissipation, depending on the temperature of their surroundings. Explain with reference to surface area and volume. (Think about the need for heat retention in cold climates or heat shedding in hot climates and make a prediction about body types.)
9. "Bergman's Rule" says that among species of animals which have a global distribution, adult body size tends to be largest in the polar regions, medium in temperate climates and smallest in tropical ones. Although there are exceptions, this is generally true. Why should it be so?
10. Challenge Question: In one of my favorite old monster movies, Them, giant ants attack the city. Unfortunately, it could never happen. The incredible strength of the ant is dependent upon its small size. Scale him up to even human size and he'd collapse under his own weight on those skinny little legs. Volume (and therefore weight) scales to the power of 3 while surface area (and size) scale to the power of 2. Create a graph that shows why the giant ant can't destroy the city, but instead would collapse under its own weight.
11. Challenge Question: As shown empirically in Brody's graph, power is proportional to mass to the power of 0.734, roughly 3/4, yet surface area to volume ratio predicts a value of only 2/3 or 0.67. Animals in the real world do better than expected, but animals in the real world don't rely entirely on surface area for heating, cooling, gas exchange, etc. Is is possible that the circulatory system allows larger organisms to improve upon the surface area to volume problem? Explain.
Further Reading:
http://www.tiem.utk.edu/~gross/bioed/bealsmodules/area_volume.html