 1. If BMR and body weight of animals are related in a consistent manner, we can use measurements from studying some species to infer values about others that we have not studied. We will draw a graph of the information from the web page from the course content page link to "thermoneutral zone" and use that to make our inferences. First enter the numbers for bird mass and BMR into a spreadsheet such as Excel.
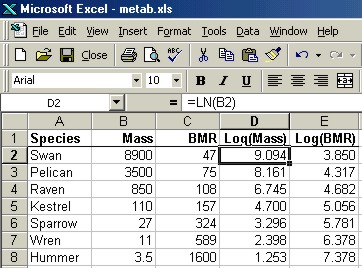
Since the numbers cover a wide range of values, from almost zero to thousands, it makes sense to transform the raw numbers to logarithms before drawing the graph. This process can be accomplished easily in the spreadsheet by making two additional columns and using the natural log function that is built in (see the formula up above in the formula bar).

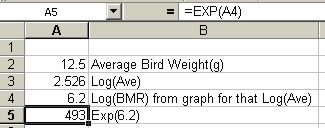 3. Pick a bird and find its average weight in grams, e.g., 12.5g. Convert the raw grams to the natural log (=2.526), just as when constructing the graph. Find the log of the mass along the x-axis and read the LN(BMR) (along the y-axis) that corresponds to it (approximately 6.2). Then take the exponential of 6.2 (see the function in the formula bar), and that equals 493 Kcal/kg/day rounded off.