 |
Suppose that we are examining the reproductive potential of the Western Bluebird compared to the Eastern Bluebird. It has been determined from the observation of 945 nests that the average clutch size of the Eastern Bluebird is 4.49 eggs with a range from 2 to 7 eggs.[1]
Collecting the Data
We would like to find out if the clutch size of the Western Bluebird is the same or different from the clutch size of the Eastern Bluebird. We set out to examine 1,000 nests of the Western Bluebird and finished our sampling with results from 950 nests.
 |
We will calculate a statistic (a number calculated from a sample[2], in this case the statistic for a t-test, which is based on the assumption of a normal distribution of such calculated numbers). We want to reject the null hypothesis that the two species possess the same clutch size only if the evidence is strong enough to indicate that they do not possess the same clutch size (i.e., their clutch sizes are different).
A Chance Result
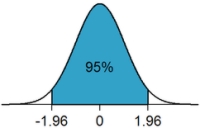
There is always the possibility that merely by chance we found nests that contained more (or fewer) eggs than were characteristic of the population of Western Bluebirds. We can, and should, choose a low probability of rejecting a true null hypothesis based on egg counts that were extreme only by chance. The normal distribution shows that a probability of 0.05, or 5%, or 5 times out of 100, is low and will make it unlikely that we will make a Type I error. Under those circumstances, we can feel 95% confident that an extreme result represents a real departure from the prediction of the null hypothesis - that is, an extreme result demonstrates that the average clutch size of the Western Bluebird really is different from that of the Eastern Bluebird.
Specific Circumstances and the Cost of Mistakes
Everyone would like to avoid making a mistake, especially by chance, and so a low probability of rejecting the null hypothesis when it is true (a Type I error) is chosen. But 0.05 is not a magic number and certain conditions may justify a different probability, especially if the cost of the error is considered. For instance, if a new drug with known side effects is being tested for being able to cure a deadly disease, then we would want to be sure that its curative powers are real if patients would have to suffer the side effects. Therefore, we would want to require that there be strong proof in rejecting the null hypothesis that the new drug did not cure the disease and perhaps choose a probability of making a Type I error to be 0.01 or even 0.001.
Sample Size and Practicality
Statistics help us reach conclusions about a population based on samples of individuals taken from the population. Individuals chosen in those samples should be representative of the diversity of the population and unbiased in selection so as not to lead to erroneous conclusions. In general, larger samples more accurately estimate population characteristics. In addition, larger samples tend to reduce the probability of mistakes in testing hypotheses, both Type I and Type II errors. Nevertheless, determining the appropriate size of the sample needs to balance the benefits of more accurate estimates and a smaller chance of making mistakes with the cost of working with larger samples.
References: 1. Clutch-size Variation in Eastern Bluebirds , 2. Dixon, W. J., and F. J. Massey, Jr. 1969. Introduction to Statistical Analysis. Third Edition. McGraw-Hill. NY., 3. WILDLIFE SPECIES: Sialia mexicana, 4. How many eggs does a bird lay?